


Buy Giro d'Italia 2020 data poster, Tour of Italy by Studio Vlak on canvas, ArtFrame, poster and wallpaper, printed on demand in high quality.
About "Giro d'Italia 2020 data poster, Tour of Italy"
by Studio Vlak
About the artwork
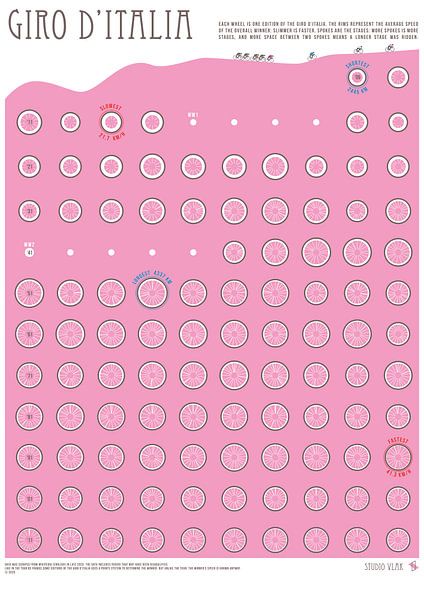
Relive every Tour of Italy / Giro d'Italia from 1909 to 2020 with this data poster from Studio Vlak. Each wheel represents an edition of the Giro. The rim thickness represents the average speed of the winner: thinner is faster. Each spoke represents a stage: more spokes mean more stages, and if there is more space between spokes then a longer stage has been ridden.
Hang this Eye-catcher on your wall and discover every day new data about the Giro d'Italia, your favorite big tour in cycling. In which year was the race the fastest? Was the Giro always this long? How many stages were there in the fifties?

About Studio Vlak
Studio Vlak visualizes, tells and explains... Read more…
 Cycling
 Drawings
 Joyful Moments
 Serene Peace
 Sports and hobbies
 Netherlands
 Ordered in November 2021
Netherlands
Ordered in April 2021
Netherlands
Ordered in October 2017
Netherlands
Ordered in November 2021
Netherlands
Ordered in April 2021
Netherlands
Ordered in October 2017
Netherlands Ordered in December 2024
Netherlands
Ordered in June 2019
Netherlands
Ordered in January 2022
Ordered in December 2024
Netherlands
Ordered in June 2019
Netherlands
Ordered in January 2022
 Germany
 Ordered in January 2021
Netherlands
Ordered in October 2021
Germany
Ordered in December 2021
Germany
Ordered in August 2023
Netherlands
Ordered in December 2021
Netherlands
Ordered in August 2023
Ordered in January 2021
Netherlands
Ordered in October 2021
Germany
Ordered in December 2021
Germany
Ordered in August 2023
Netherlands
Ordered in December 2021
Netherlands
Ordered in August 2023